This machine learning prediction system is the product of 7 generations of work towards a commercial result in collaboration with Cornell’s Masters of Applied Statistics. We have been working with Cornell now coming into our 11th year and for many such years we have worked on machine learning predictions and made many failed attempts in our journey.
Paradoxically, in such endeavors, failure is often disguised as success. The healthy skepticism of a (slightly) grey-haired professional investor has been an invaluable lens to lead A.I projects. Sober fiduciary ethos and risk-minded thinking keep these small failures far removed from client accounts and isolated to the R&D environment of tools like AWS SageMaker and Juypter Notebooks. We also like to rely on heavy data visualization to help validate / invalidate batch results.
We have had our successes too and below we outline the schematic of our A.I predictions, having assimilated many of our successes and avoiding those pitfalls encountered along the journey. We shall keep the technical jargon out of it as our intended audience is sophisticated investors.
As all the students have likely grown tired of hearing, “An A.I. Stock Market prediction if nothing if not first trustworthy.”

The prediction system is built using a hierarchical composition of various prediction systems. In this way, the machine learning predictions mimics a prediction scheme that futurist and author Ray Kurzweil talks about in his book, “How to Build a Mind.” That book is largely concerned with the building of a general intelligence. Kurzweil draws strong parallels between successful machine learning or artificial intelligence and the way the human brain works in a hierarchical manner giving rise to the neocortex capable of abstract and creative thought.
Another analogy is that of weather forecasting. Now, weather forecasting represents the composite of tens of thousands of barometric, wind, humidity and temperature readings all over the globe, especially when combined with centuries of recorded weather for any given date, meteorologists can now forecast the weather better than any time in our history. To forecast the weather in Poughkeepsie you don’t forecast the same way as you would for San Antonio, TX. Likewise, the forecast for July 25th is quite different than the forecast for December 25th.
So it is with predictions for stocks. In order to create a globally efficacious prediction model, we believe that you can build it up from successful smaller models. But we knew we had to have the individual quirks or each stock,
Stock market predictions will never see the type of success as weather forecasting. We must recognize our fallibility. Stock prices are an emergent property of a many layered large scale socio-economic systems. Note quite chaotic, but much more chaotic that weather. Recall Benjamin Martin’s shooting advice in the movie, “The Patriot”, “Aim small, miss small.”
If your expectation for machine learning forecasts is to get rich quick, you will see the usual result. If your expectation is to consistently add a few incremental percentage points of return to a prudent investment process, then you are in the right place.

With our extensive background in portfolio optimization, generating expected returns for investment candidates is a paramount input. For many years, our various software platforms including Portfolio Thinktank, Gravity Investments, and everything we do at www.gsphere.net have built portfolios where the expected returns are produced for any stock, fund, currency or asset based on a multi-sampling expert system. That is to say we are using historical performance to predict the future by more optimally selecting (and weighing) multiple historical periods previously observed to offer a predictive advantage.
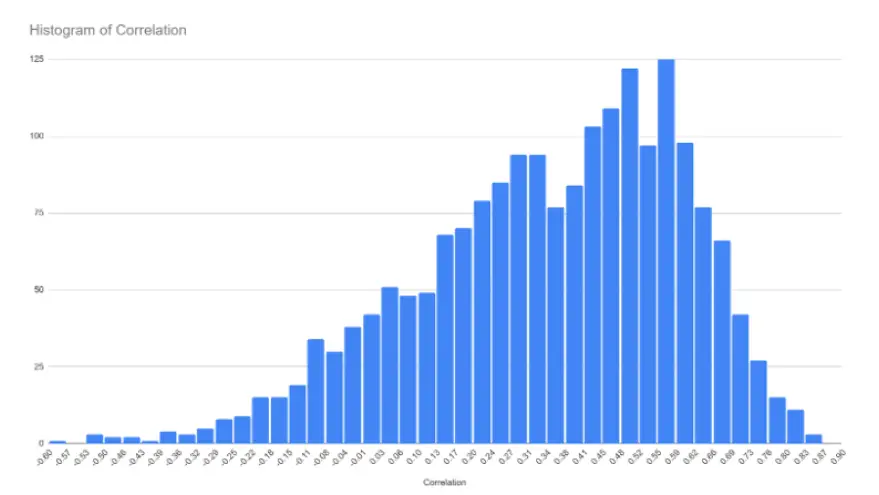
This technique has served investors well and has been demonstrated to offer a predictive advantage as measured by an in-sample, out-of-sample correlation of approximately 20% – 30%, depending on the assets and time horizon. This means that if the market delivers a 10% APR then we expect to deliver an extra 2.5% return.
More than half of this comes from the momentum signal. Momentum is regularly observed to be the factor offering the greatest return and is a nice bed fellow within a diversification portfolio strategy. For a nice chart on factor performance see; factor investing
Our success in these quantitative forecasting methods has served as a hurdle rate that any machine learning prediction must outperform for it to serve customers better than our existing systems.
Also, having built perhaps the best portfolio back-testing engine in the industry, we have been zealous about biases and proper controls processes to ensure the utmost integrity of results.
These two traits served as both barriers and stepping stones enabling Portfolio ThinkTank to take the long view in designing our stock market prediction system: Like what we have built for portfolio optimization and analysis, we set to build a prediction system that we expect to use for the next decade or two.

The first thing we did was decide that each stock should have its prediction model. This means that the data used to predict each stock is uniquely trained to the specific dynamics of that stock.
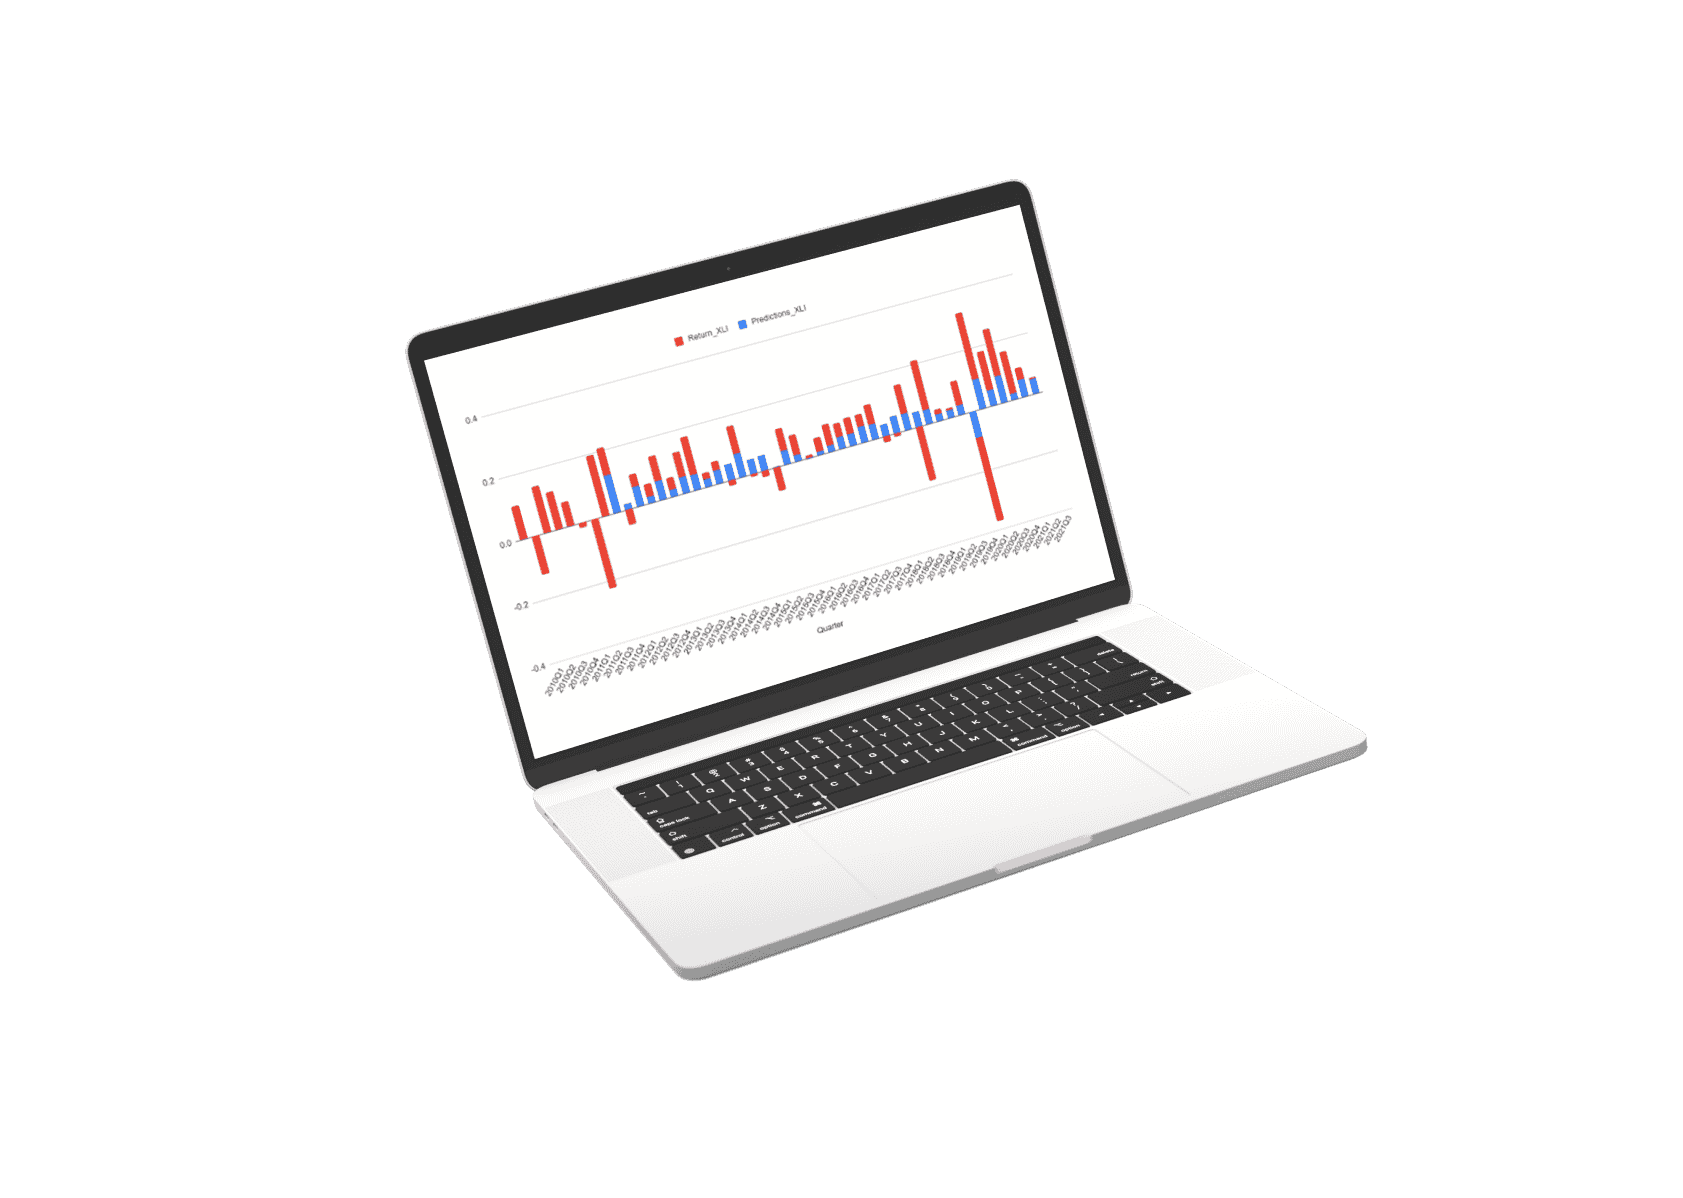
The prediction for every stock is a composite of three separate prediction systems. A prediction for the stock market, a prediction for the sector, and a prediction model for the stock’s alpha: Alpha is the return that a stock generates independent of the stock market influence.


James Damschroder